

PyVBMC Example 2: Understanding the inputs and the output trace#
In this notebook, we will discuss more in detail the inputs and the output trace of the PyVBMC algorithm, including a discussion on how to set parameter bounds and starting point. We also describe the items in the output trace, and display the evolution of the variational posterior in each iteration.
This notebook is Part 2 of a series of notebooks in which we present various example usages for VBMC with the PyVBMC package. The code used in this example is available as a script here.
import sys

if "google.colab" in sys.modules:  # Colab lacks PyVBMC: install it
    %pip install --upgrade "pyvbmc[examples]"
import numpy as np
import scipy.stats as scs
from pyvbmc import VBMC

np.random.seed(42)
1. Model definition: log-likelihood, log-prior, and log-joint#
We use the same toy target function as in Example 1, a broad Rosenbrock’s banana function in \(D = 2\).
D = 2  # still in 2-D


def log_likelihood(theta):
    """D-dimensional Rosenbrock's banana function."""
    theta = np.atleast_2d(theta)

    x, y = theta[:, :-1], theta[:, 1:]
    return -np.sum((x**2 - y) ** 2 + (x - 1) ** 2 / 100, axis=1)
To make the problem more interesting, we will assume parameters to be constrained to be positive, that is \(x_d > 0\) for \(1 \le d \le D\).
Since parameters are strictly positive, we impose an independent exponential prior on each variable (again, you could choose here whatever you want). We then define the log-joint (our target) as log-likelihood plus log-prior.
prior_tau = 3 * np.ones((1, D))  # Length scale of the exponential prior


def log_prior(x):
    """Independent exponential prior."""
    return np.sum(scs.expon.logpdf(x, scale=prior_tau))


def log_joint(x):
    """log-density of the joint distribution."""
    return log_likelihood(x) + log_prior(x)
2. Parameter setup: bounds and starting point#
Choosing parameter bounds#
Bound settings require some discussion:
the specified (hard) bounds are not included in the domain, so in this case, since we want the parameters to be positive, we can set the lower bounds
LB = 0, knowing that the parameter will always be greater than zero.
LB = np.zeros((1, D)) # Lower bounds
Currently, PyVBMC does not support half-bounds, so we need to specify a finite upper bound (cannot be
inf). We pick something very large according to our prior. However, do not go crazy here by picking something impossibly large, otherwise PyVBMC will likely fail.
UB = 10 * prior_tau # Upper bounds
Plausible bounds need to be meaningfully different from the hard bounds, so here we cannot set the plausible lower bounds
PLB = 0. We follow the same strategy as the first example, by picking the top ~68% credible interval of the prior.
PLB = scs.expon.ppf(0.159, scale=prior_tau)
PUB = scs.expon.ppf(0.841, scale=prior_tau)
Choosing the starting point#
Good practice is to initialize PyVBMC in a region of high posterior density.
With no additional information, uninformed approaches to choose the starting point \(\mathbf{x}_0\) include picking the mode of the prior, or, if you need multiple points, a random draw from the prior or a random point uniformly chosen inside the plausible box. None of these approaches is particularly recommended, though, especially when facing more difficult problems.
It is generally better to adopt an informed starting point \(\mathbf{x}_0\). A good choice is typically a point in the approximate vicinity of the mode of the posterior (no need to start exactly at the mode). Clearly, it is hard to know in advance the location of the mode, but a common approach is to run a few optimization steps on the target (starting from one of the uninformed options above).
For this example, we cheat and start in the proximity of the mode, exploiting our knowledge of the toy likelihood, for which we know the location of the maximum.
x0 = np.ones((1, D)) # Optimum of the Rosenbrock function
3. Initialize and run inference#
Finally, we initialize and run PyVBMC.
Output trace#
Before the first iteration, PyVBMC states whether it assumes exact or noisy evaluations of the target and which performance settings it uses. The first run in a Python session that finds no saved calibration also suggests running pyvbmc.calibrate(), which tunes those settings to your machine without evaluating your model. A run may also print a tip.
In each iteration, the PyVBMC output trace prints the following information:
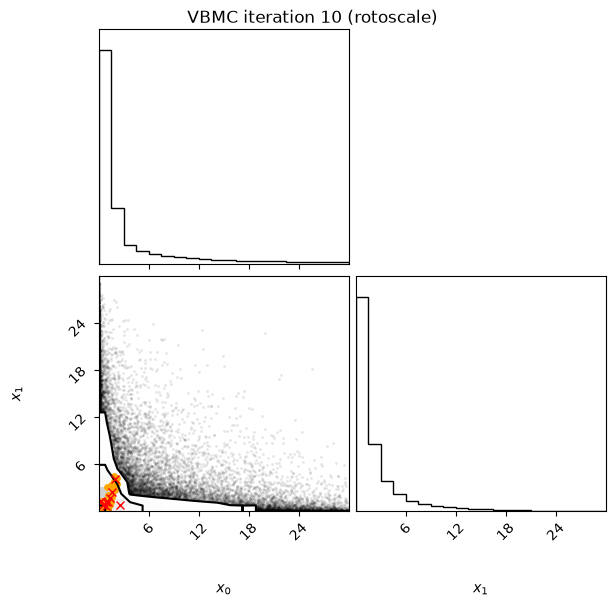
Iteration: iteration number (starting from 0, which follows the initial design).f-count: total number of thetargetfunction evaluations so far.Mean[ELBO]: Estimated mean of theelbo.Std[ELBO]: Standard deviation of the estimatedelbo.sKL-iter[q]: Gaussianized symmetrized Kullback-Leibler divergence between the variational posterior in the previous and current iteration. In brief, a measure of how much the variational posterior \(q\) changes between iterations.K[q]: Number of mixture components of the variational posterior.Convergence: A number that summarizes the stability of the current solution, by weighing various factors such as the change in theelboand in the variational posterior across iterations, and the uncertainty in theelbo. Values (much) less than 1 correspond to a stable solution and thus suggest convergence of the algorithm.Action: Major actions taken by the algorithm in the current iteration. Common actions/events are:start warm-upandend warm-up: start and end of the initial warm-up stage;rotoscale(andundo rotoscale): rotate and re-scale the inference space to make inference more tractable (undo the rotoscaling if there is no significant improvement);trim data: remove some points to increase stability;switch to GP opt: stop sampling the hyperparameters of the Gaussian-process surrogate and optimize them instead;stable: solution stable for multiple iterations;finalize: refine the variational approximation with additional mixture components.
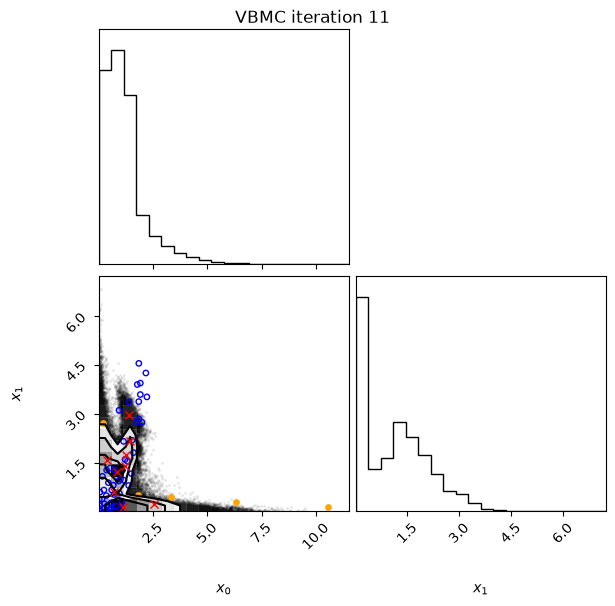
After a rotoscale, the estimates can swing for a few iterations while the GP surrogate and the variational posterior adjust to the new space. The estimated ELBO can first rise, when the variational posterior spreads into a region where the surrogate has no evaluations yet and overestimates the target, and then drop when the next iterations evaluate the target there. The Convergence value rises with these swings, and the solution counts as stable only once they have settled.
Iteration plotting#
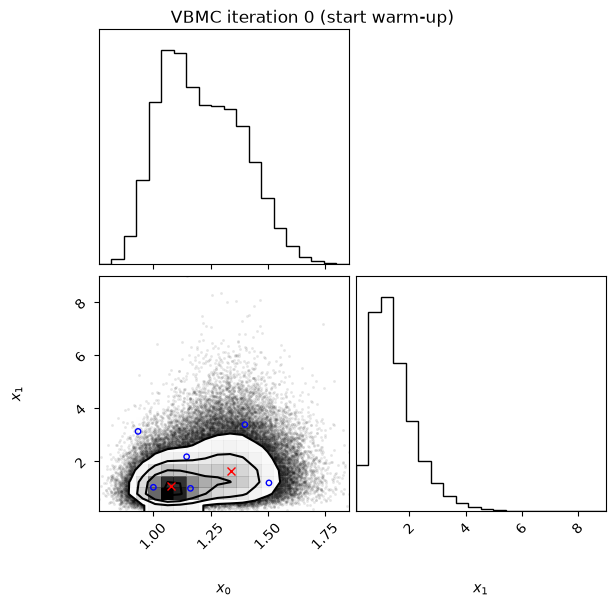
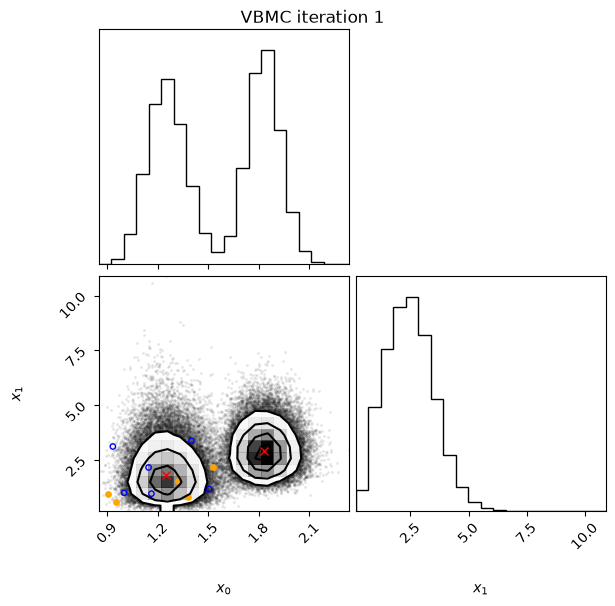
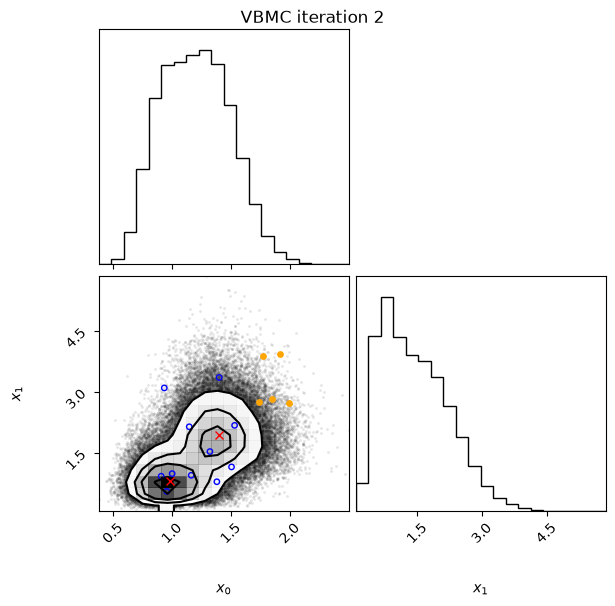
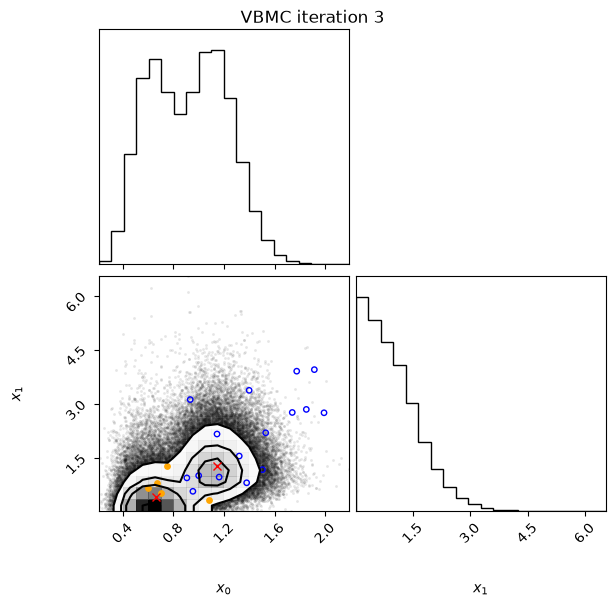
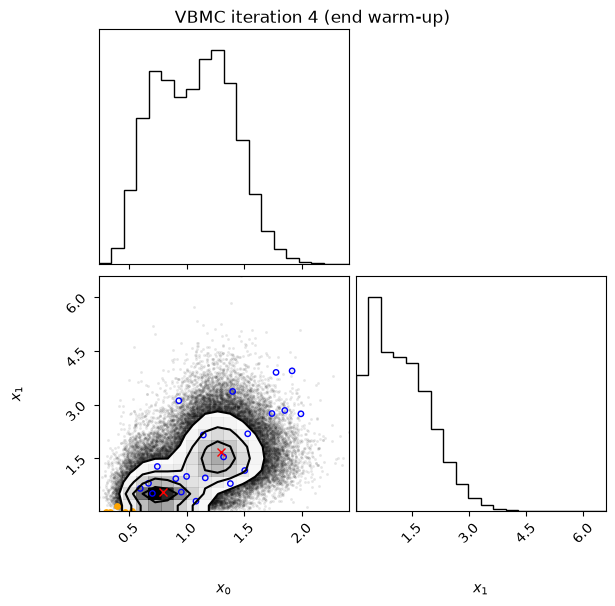
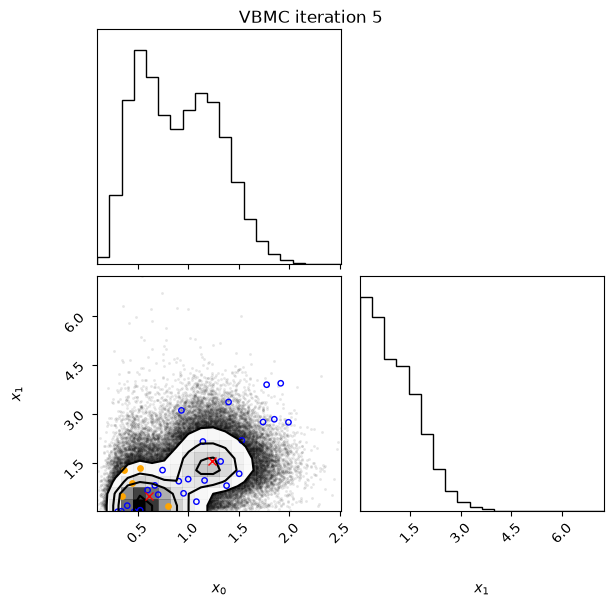
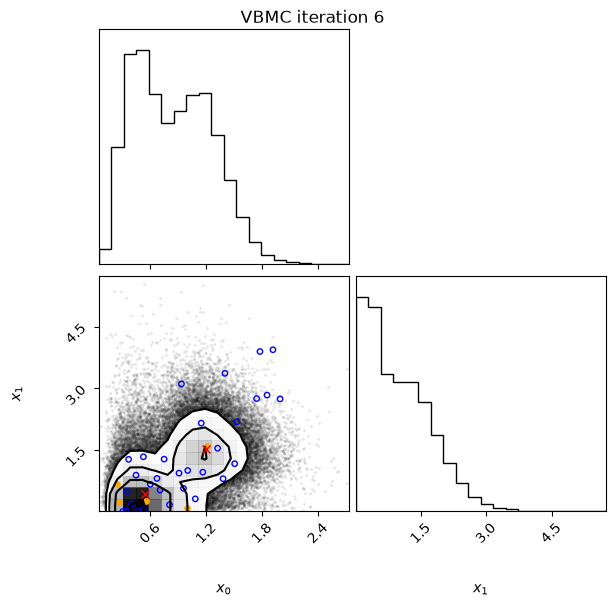
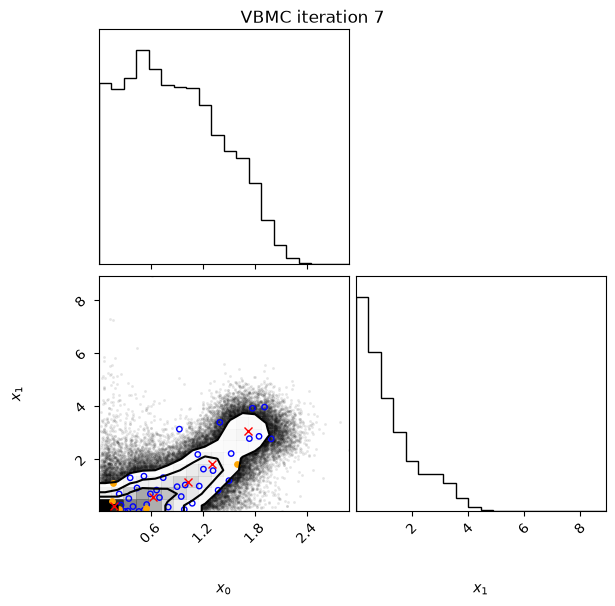
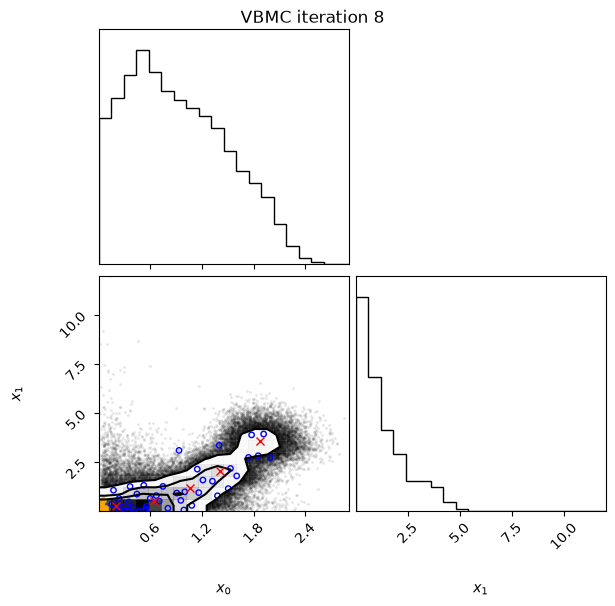
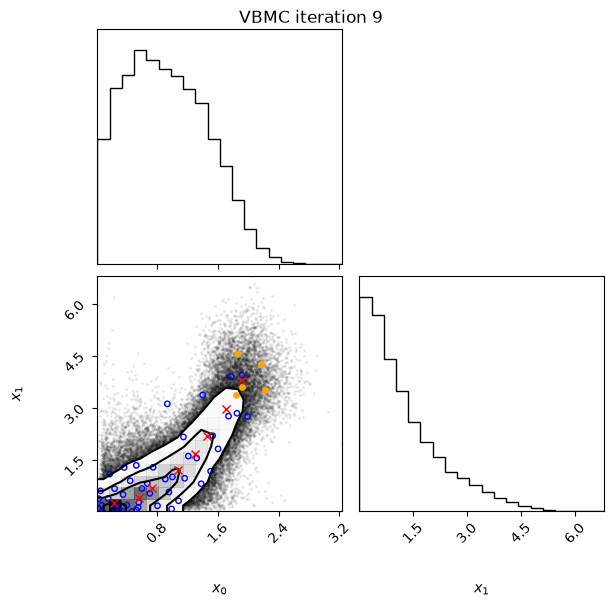
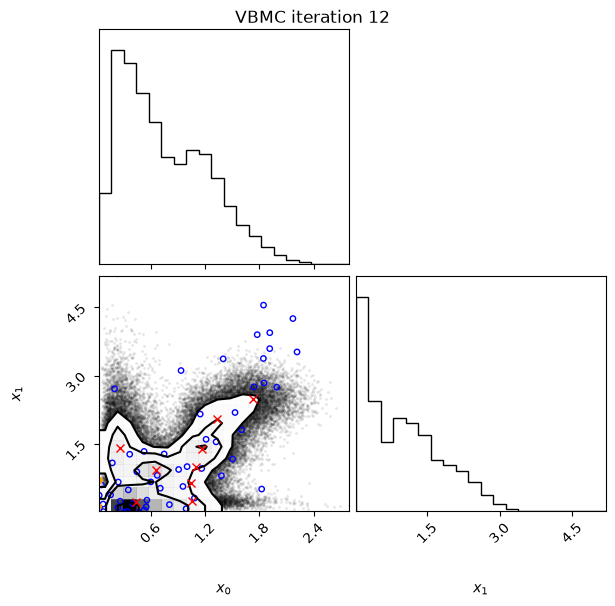
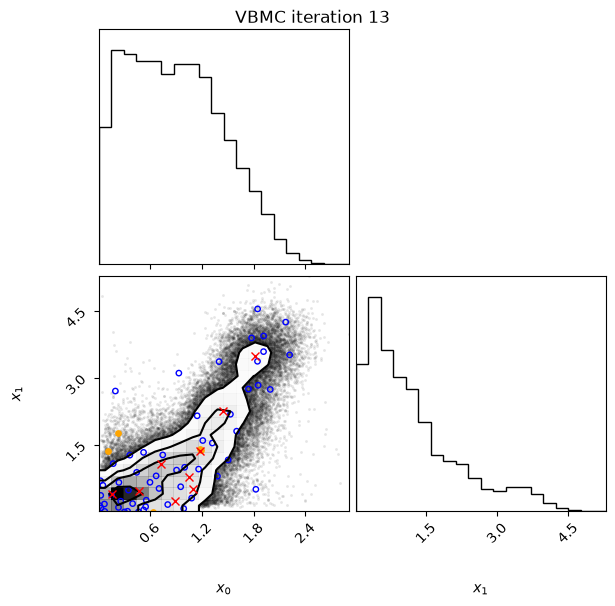
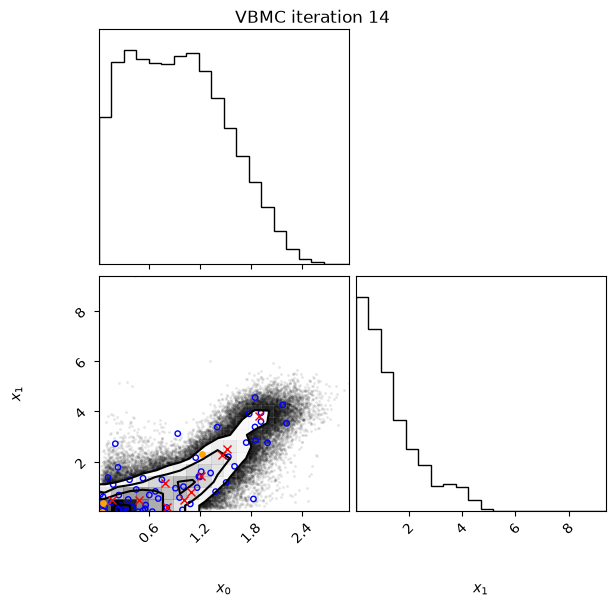
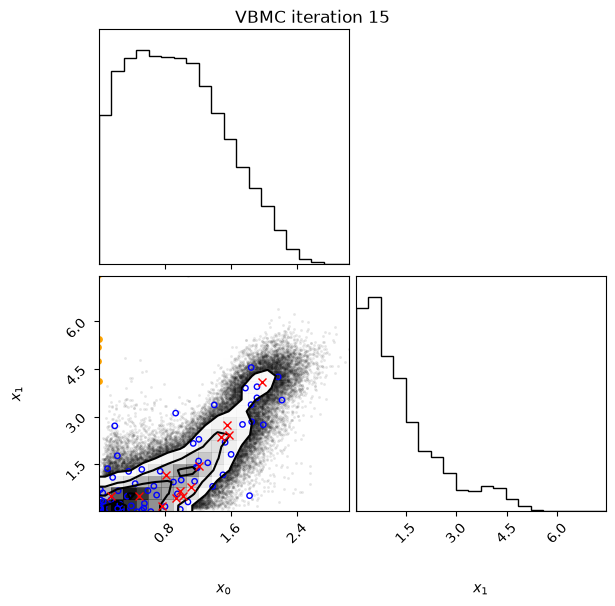
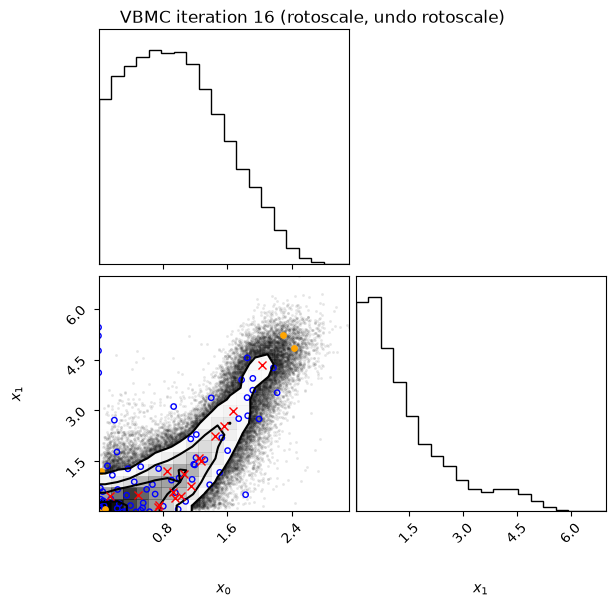
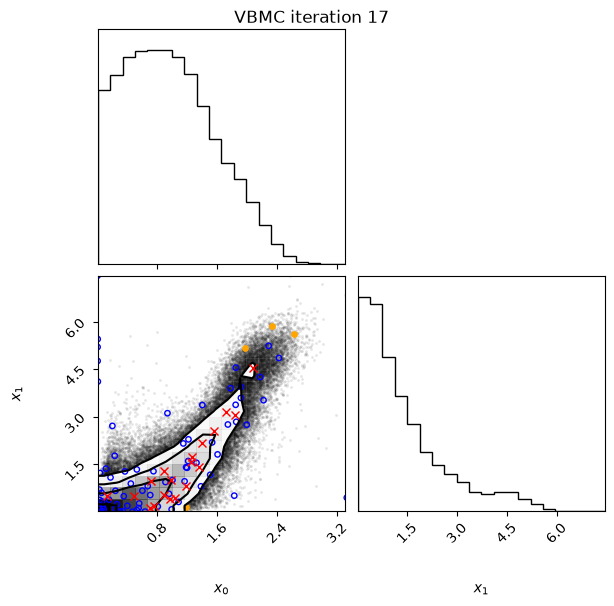
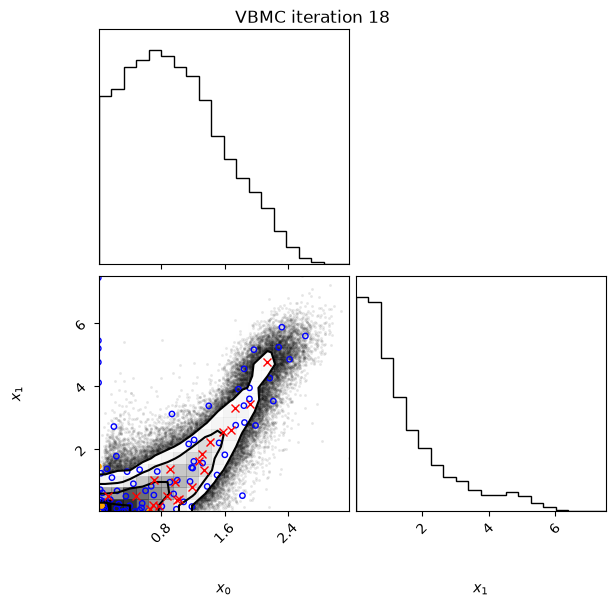
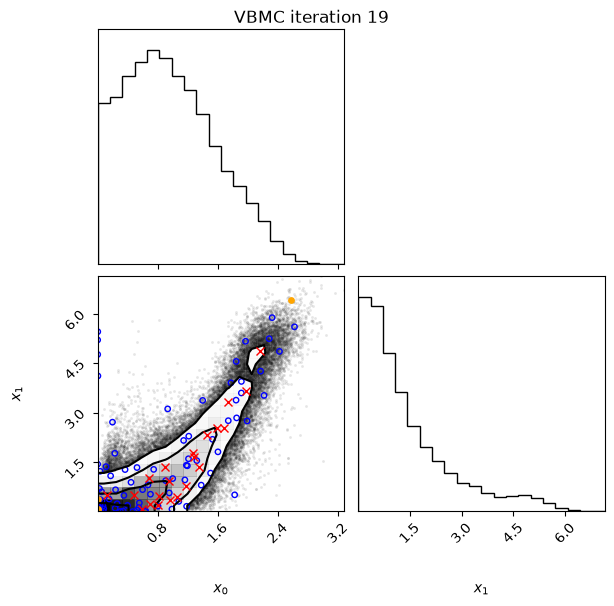
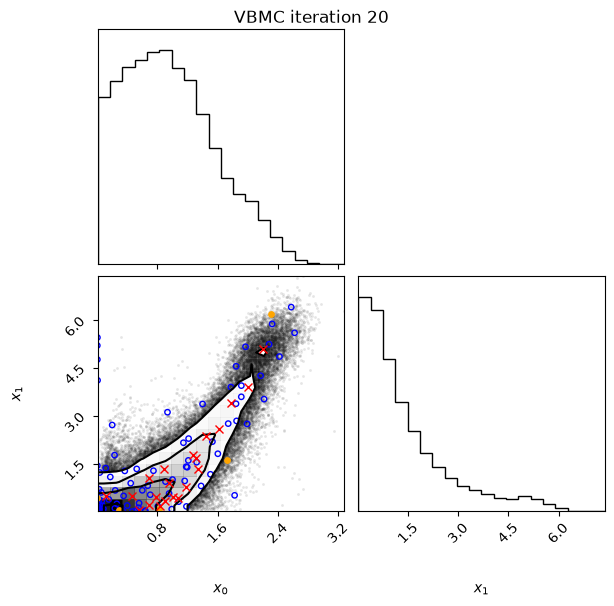
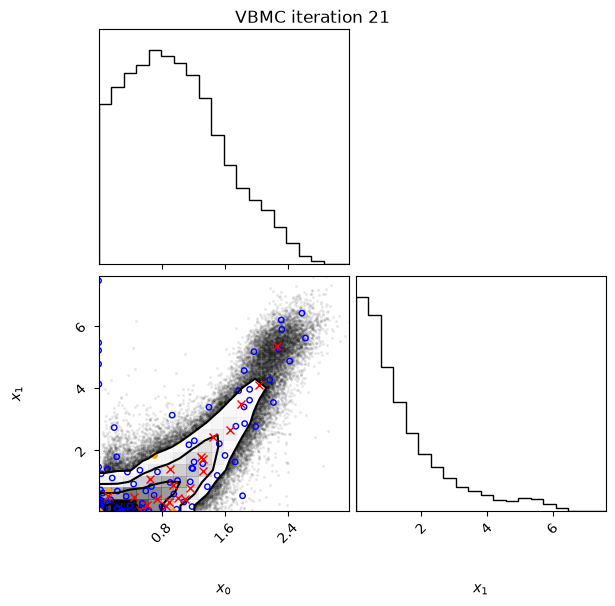
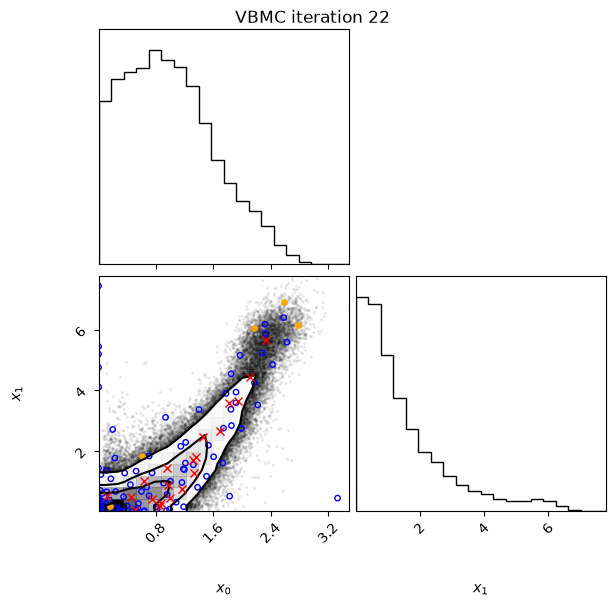
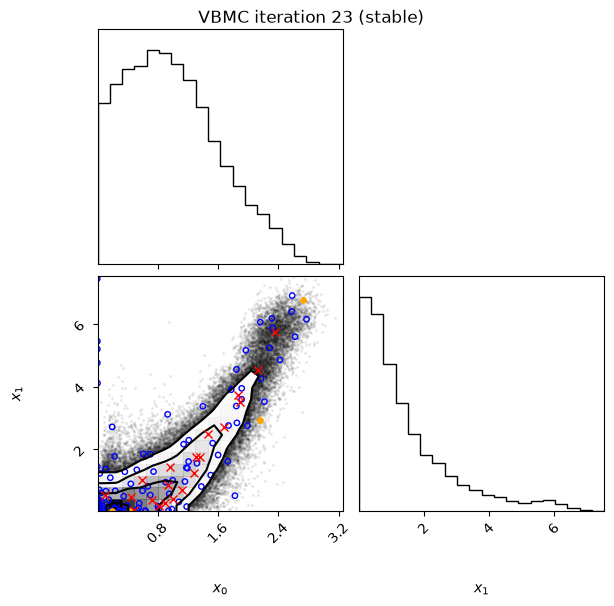
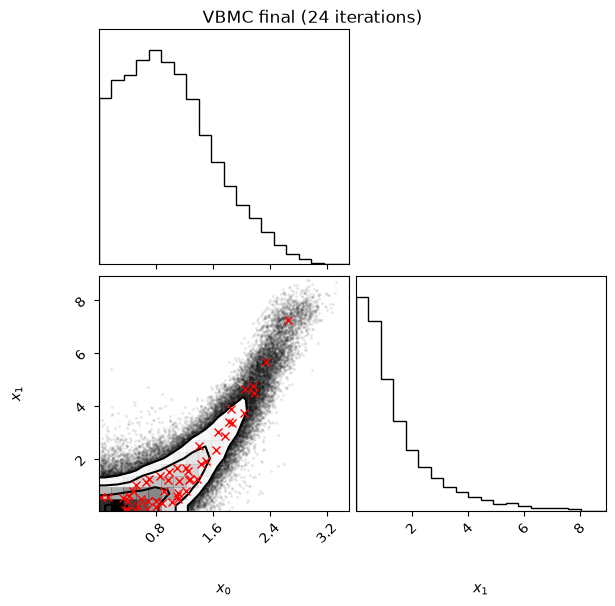
In this example, we also switch on the plotting of the current variational posterior at each iteration with the user option plot. Regarding the iteration plots:
Each iteration plot shows the multidimensional variational posterior in the current iteration via one- and two-dimensional marginal plots for each variable and pairs of variables, as you would get from
vp.plot()(see also Example 1).In each plot, blue circles represent points in the training set of the GP surrogate model, and orange dots are points added to the training set in this iteration.
The red crosses are the centers of the variational mixture components.
Since PyVBMC with plotting on can occupy a lot of space on the notebook, you may want to scroll its output: in JupyterLab and in Jupyter Notebook 7, right-click the output and choose “Enable Scrolling for Outputs”.
# initialize VBMC
options = {"plot": True}
vbmc = VBMC(log_joint, x0, LB, UB, PLB, PUB, options)
# Printing will give a summary of the vbmc object:
# bounds, user options, etc.:
print(vbmc)
VBMC:
    dimension = 2,
    x0: [[1., 1.]] : ndarray,
    lower bounds: [[0., 0.]] : ndarray,
    upper bounds: [[30., 30.]] : ndarray,
    plausible lower bounds: [[0.5195, 0.5195]] : ndarray,
    plausible upper bounds: [[5.5166, 5.5166]] : ndarray,
    log-density = <function log_joint at 0x0000018052D96AC0>,
    log-prior = None,
    prior sampler = None,
    variational posterior = VariationalPosterior:
        dimension = 2,
        num. components = 2,
        means:
            [[-0.27, -0.27],
             [-0.27, -0.27]] : ndarray,
        weights: [[0.5, 0.5]] : ndarray,
        sigma (per-component scale): [[0.001, 0.001]] : ndarray,
        lambda (per-dimension scale):
            [[1.],
             [1.]] : ndarray,
        stats = None,
    Gaussian process = None,
    user options = User Options:
        plot: True (Plot marginals of variational posterior at each iteration)
# run VBMC
vp, results = vbmc.optimize()
Beginning variational optimization assuming EXACT observations of the log-joint.
Performance settings: saved calibration.
Tip: Using S-VBMC, you can improve your posterior estimates by combining multiple independent PyVBMC runs on the same model and data. S-VBMC re-optimizes mixture weights to form a combined posterior without new model evaluations. See Example 7 to combine your runs with pyvbmc.SVBMC and draw samples.
https://acerbilab.org/pyvbmc/_examples/pyvbmc_example_7_stacking.html
 Iteration  f-count    Mean[ELBO]    Std[ELBO]    sKL-iter[q]   K[q]  Convergence  Action
     0         10          -3.32         0.30     32405.48        2        inf     start warm-up
 Iteration  f-count    Mean[ELBO]    Std[ELBO]    sKL-iter[q]   K[q]  Convergence  Action
     1         15          -1.04         3.74         1.87        2        inf
 Iteration  f-count    Mean[ELBO]    Std[ELBO]    sKL-iter[q]   K[q]  Convergence  Action
     2         20          -2.70         0.19         1.01        2       29.9
 Iteration  f-count    Mean[ELBO]    Std[ELBO]    sKL-iter[q]   K[q]  Convergence  Action
     3         25          -2.35         0.39         0.49        2         14
 Iteration  f-count    Mean[ELBO]    Std[ELBO]    sKL-iter[q]   K[q]  Convergence  Action
     4         30          -2.50         0.03         0.12        2       3.43     end warm-up
 Iteration  f-count    Mean[ELBO]    Std[ELBO]    sKL-iter[q]   K[q]  Convergence  Action
     5         35          -2.31         0.04         0.15        2       4.38
 Iteration  f-count    Mean[ELBO]    Std[ELBO]    sKL-iter[q]   K[q]  Convergence  Action
     6         40          -2.26         0.04         0.02        2      0.644
 Iteration  f-count    Mean[ELBO]    Std[ELBO]    sKL-iter[q]   K[q]  Convergence  Action
     7         45          -1.99         0.34         0.19        5       6.45
 Iteration  f-count    Mean[ELBO]    Std[ELBO]    sKL-iter[q]   K[q]  Convergence  Action
     8         50          -1.97         0.04         0.03        5      0.904
 Iteration  f-count    Mean[ELBO]    Std[ELBO]    sKL-iter[q]   K[q]  Convergence  Action
     9         55          -1.98         0.02         0.03        8      0.736
 Iteration  f-count    Mean[ELBO]    Std[ELBO]    sKL-iter[q]   K[q]  Convergence  Action
    10         55          -0.82         0.87       118.00        9   2.79e+03     rotoscale
 Iteration  f-count    Mean[ELBO]    Std[ELBO]    sKL-iter[q]   K[q]  Convergence  Action
    11         60        -104.79        10.60        17.34        9        791
 Iteration  f-count    Mean[ELBO]    Std[ELBO]    sKL-iter[q]   K[q]  Convergence  Action
    12         65          -2.44         0.05         1.78        9        383
 Iteration  f-count    Mean[ELBO]    Std[ELBO]    sKL-iter[q]   K[q]  Convergence  Action
    13         70          -2.03         0.01         0.21        9       6.46
 Iteration  f-count    Mean[ELBO]    Std[ELBO]    sKL-iter[q]   K[q]  Convergence  Action
    14         75          -1.98         0.01         0.02       10      0.569
 Iteration  f-count    Mean[ELBO]    Std[ELBO]    sKL-iter[q]   K[q]  Convergence  Action
    15         80          -1.97         0.00         0.00       13      0.143
 Iteration  f-count    Mean[ELBO]    Std[ELBO]    sKL-iter[q]   K[q]  Convergence  Action
    16         85          -1.95         0.00         0.01       16      0.209     rotoscale, undo rotoscale
 Iteration  f-count    Mean[ELBO]    Std[ELBO]    sKL-iter[q]   K[q]  Convergence  Action
    17         90          -1.94         0.00         0.00       19     0.0637
 Iteration  f-count    Mean[ELBO]    Std[ELBO]    sKL-iter[q]   K[q]  Convergence  Action
    18         95          -1.93         0.00         0.00       21     0.0752
 Iteration  f-count    Mean[ELBO]    Std[ELBO]    sKL-iter[q]   K[q]  Convergence  Action
    19        100          -1.92         0.00         0.00       21     0.0311
 Iteration  f-count    Mean[ELBO]    Std[ELBO]    sKL-iter[q]   K[q]  Convergence  Action
    20        105          -1.91         0.00         0.00       21     0.0374
 Iteration  f-count    Mean[ELBO]    Std[ELBO]    sKL-iter[q]   K[q]  Convergence  Action
    21        110          -1.91         0.00         0.00       21     0.0372
 Iteration  f-count    Mean[ELBO]    Std[ELBO]    sKL-iter[q]   K[q]  Convergence  Action
    22        115          -1.91         0.00         0.00       20     0.0811
 Iteration  f-count    Mean[ELBO]    Std[ELBO]    sKL-iter[q]   K[q]  Convergence  Action
    23        120          -1.90         0.00         0.00       20     0.0263     stable
 Iteration  f-count    Mean[ELBO]    Std[ELBO]    sKL-iter[q]   K[q]  Convergence  Action
   inf        120          -1.87         0.00         0.00       50     0.0263     finalize
Inference terminated: variational solution stable for options.tol_stable_count fcn evaluations.
Estimated ELBO: -1.871 +/-0.001.
lml_true = -1.8396  # ground truth, which we know for this toy scenario

print("The true log model evidence is:", lml_true)
print("The obtained ELBO is:", format(results["elbo"], ".3f"))
print("The obtained ELBO_SD is:", format(results["elbo_sd"], ".3f"))
The true log model evidence is: -1.8396
The obtained ELBO is: -1.871
The obtained ELBO_SD is: 0.001
We can also print the vp object to see a summary of the variational solution:
print(vp)
VariationalPosterior:
    dimension = 2,
    num. components = 50,
    means: (2, 50) ndarray,
    weights: (1, 50) ndarray,
    sigma (per-component scale): (1, 50) ndarray,
    lambda (per-dimension scale):
        [[0.832 ],
         [1.1436]] : ndarray,
    stats = {
        'elbo': -1.871277226808148,
        'elbo_sd': 0.0009908128420254463,
        'e_log_joint': -4.537991606310104,
        'e_log_joint_sd': 0.0009908128420254463,
        'entropy': 2.6667143795019563,
        'entropy_sd': 0.0,
        'stable': True,
        'I_sk': (7, 50) ndarray,
        'J_sjk': (7, 50, 50) ndarray,
        'uncertainty_handling_level': 0,
    }
4. Examine and visualize results#
We will examine now the obtained variational posterior with an interactive plot.
Note: The interactive plot is not visible in a notebook preview on GitHub. The commented-out code in the cell after it displays a static image instead (this requires the kaleido package).
# Generate samples from the variational posterior
n_samples = int(3e5)
Xs, _ = vp.sample(n_samples)

# We compute the pdf of the approximate posterior on a 2-D grid
plot_lb = np.zeros(2)
plot_ub = np.quantile(Xs, 0.999, axis=0)
x1 = np.linspace(plot_lb[0], plot_ub[0], 200)
x2 = np.linspace(plot_lb[1], plot_ub[1], 200)

xa, xb = np.meshgrid(x1, x2)  # Build the grid
xx = np.vstack(
    (xa.ravel(), xb.ravel())
).T  # Convert grids to a vertical array of 2-D points
yy = vp.pdf(xx)  # Compute PDF values on specified points
# Plotly is not a PyVBMC dependency: pip install --upgrade "pyvbmc[examples]"
# Plot approximate posterior pdf (this interactive plot does not work in higher D)
import plotly.graph_objects as go

fig = go.Figure(
    data=[
        go.Surface(z=yy.reshape(x2.size, x1.size), x=x1, y=x2, showscale=False)
    ]
)
fig.update_layout(
    autosize=False,
    width=800,
    height=500,
    scene=dict(
        xaxis_title="x_0",
        yaxis_title="x_1",
        zaxis_title="Approximate posterior pdf",
    ),
)

# Compute and plot approximate posterior mean
post_mean = np.mean(Xs, axis=0)
fig.add_trace(
    go.Scatter3d(
        x=[post_mean[0]],
        y=[post_mean[1]],
        z=vp.pdf(post_mean),
        name="Approximate posterior mean",
        marker_symbol="diamond",
    )
)

# Find and plot approximate posterior mode
# NB: We do not particularly recommend to use the posterior mode as parameter
# estimate (also known as maximum-a-posterior or MAP estimate), because it
# tends to be more brittle (especially in the PyVBMC approximation) than the
# posterior mean.
post_mode = vp.mode()
fig.add_trace(
    go.Scatter3d(
        x=[post_mode[0]],
        y=[post_mode[1]],
        z=vp.pdf(post_mode),
        name="Approximate posterior mode",
        marker_symbol="x",
    )
)
# # Display posterior also as a non-interactive static image
# from IPython.display import Image

# Image(fig.to_image(format="png"))
5. Conclusions#
In this notebook, we have discussed more in detail the input parameter settings (bounds and starting point) and the output trace of PyVBMC.
An important step still not considered in this example is a thorough validation of the results and diagnostics, which will be discussed in a later notebook.
Acknowledgments#
Work on the PyVBMC package is supported by the Research Council of Finland (grants 356498 and 358980 to Luigi Acerbi) and its Flagship programme: Finnish Center for Artificial Intelligence FCAI.